Data-Viz-Portfolio-Cardinal
| Back to Home Page | Visualizing Debt | Critique by Design | Final Project I | Final Project II | Final Project III |
Outline
Sports are an international language traversing cultures and creeds for the love of competition and camaraderie. However, the highest levels of professional sports have turned into lucrative businesses with another construct that knows no bounds–money. The flowing abundance of investment in players and teams often grows the respective game internationally for the better in most athletic competitions. Yet, many sporting reputations have been marred in recent years through funding streams deriving from controversial actors.
Journalists, academics, and human rights advocates alike categorize these dodgy investors as “sportswashing”–a buzzword referring to using the benevolence associated with sports to shift focus away from previous transgressions. State-sponsored investments representing interests from Saudi Arabia, Qatar, China, Russia, and UAE underscore nations whose decades of documented human right abuses are slowly being obscured through their role in international soccer, racing, and olympic competitions. Ultimately, it is up to the collective efforts of players, governments, the media, and fan bases to pressure against the likes of sportswashing putting a stain on the beautiful games of sport.
Story outline
Setup:
- Sports are a revenue-generating industry at the highest levels
- Foreign investments in the English Premier League (EPL), in particular, is trending upwards over the years
Conflict:
- Many foreign investors are sportswashing as they cover their human right abuses
Resolution:
- Boycotting particular clubs with sportswashing owners or events where these states are hosting can initiate ground-level changes in international sporting competitions
Initial sketches
Setup Sketch
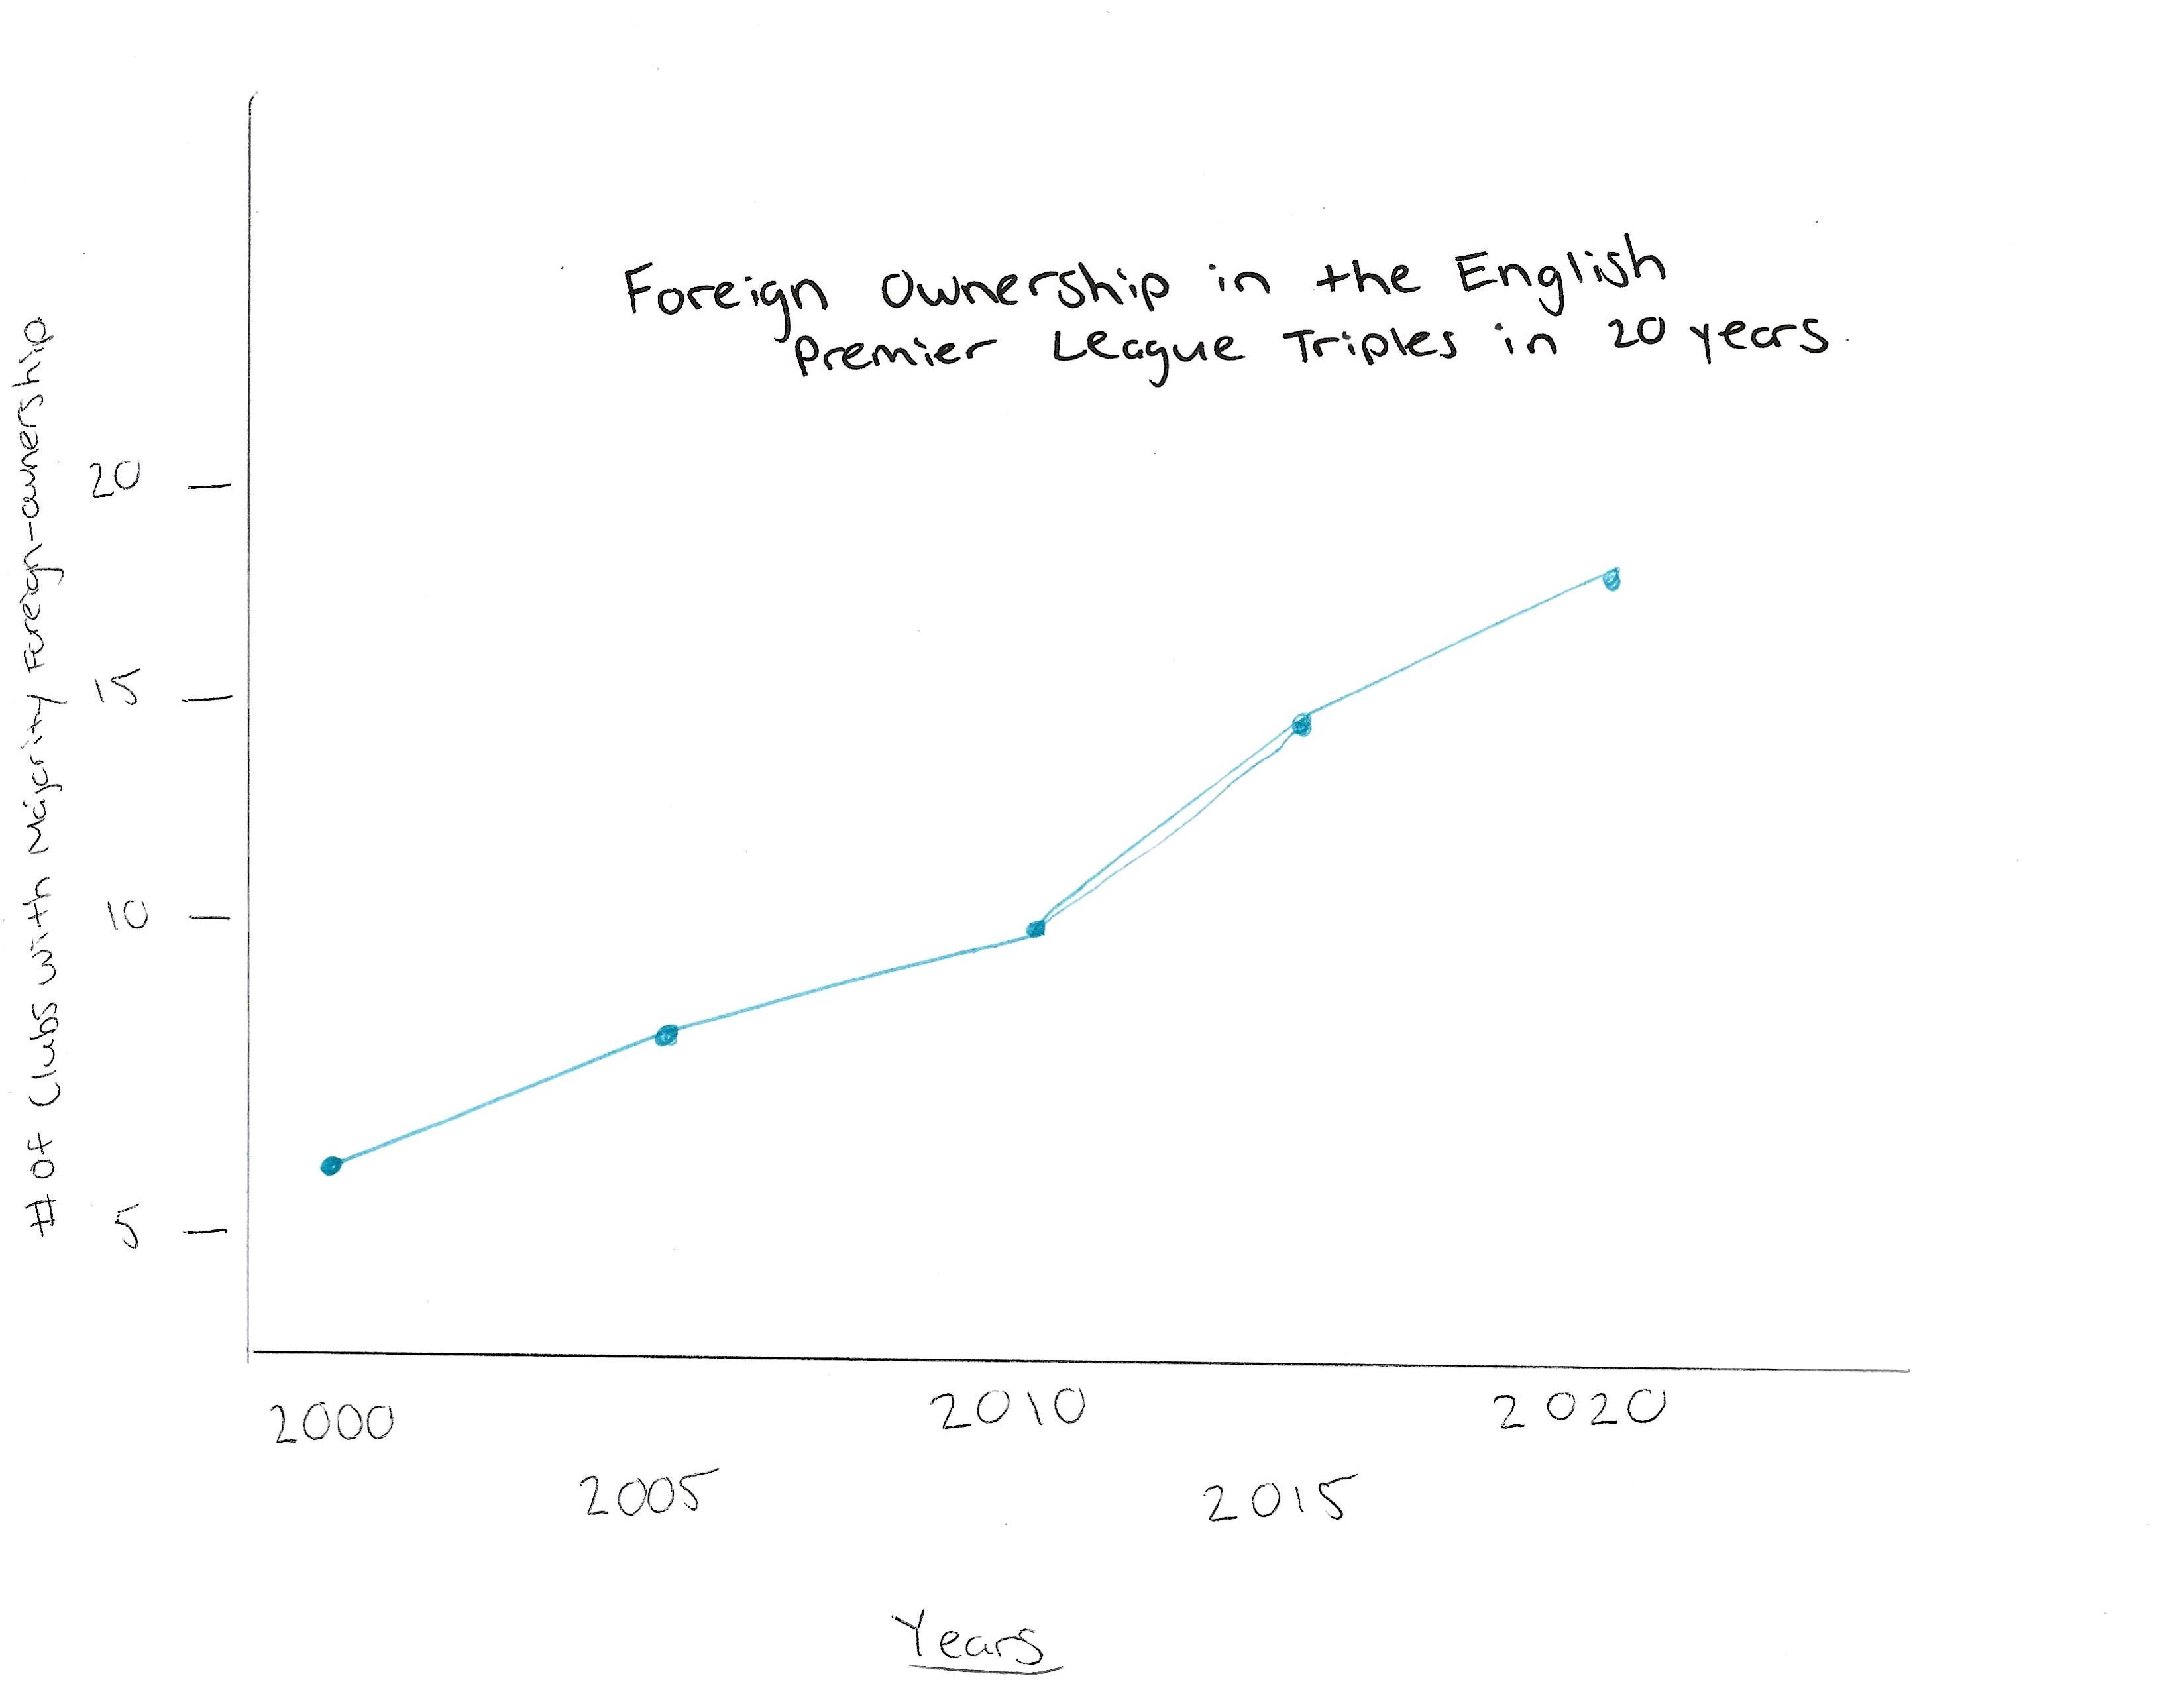 This sketch reflects the setup stage of the story by laying the visual groundwork of the growing sportswashing trend. The linechart is simple, yet effective in delineating the trend while the title itself illustrates the turn in the tide of ownership within the English Premier League–arguably, the most notable first-tier soccer league in the world. The data itself will be scraped from reputable web pages of Premier League clubs as an ownership dataset is not publically available online.
For the sports revenue point, I think an infographic or a call out statistic may be beneficial to highlight the sheer money-making potential of various sports league of note (e.g. MLB, NBA, NFL, EPL, etc.). Moreover, the grassroots resolution and call to action will benefit from call-outs and/or infographics as well.
Conflict Sketches
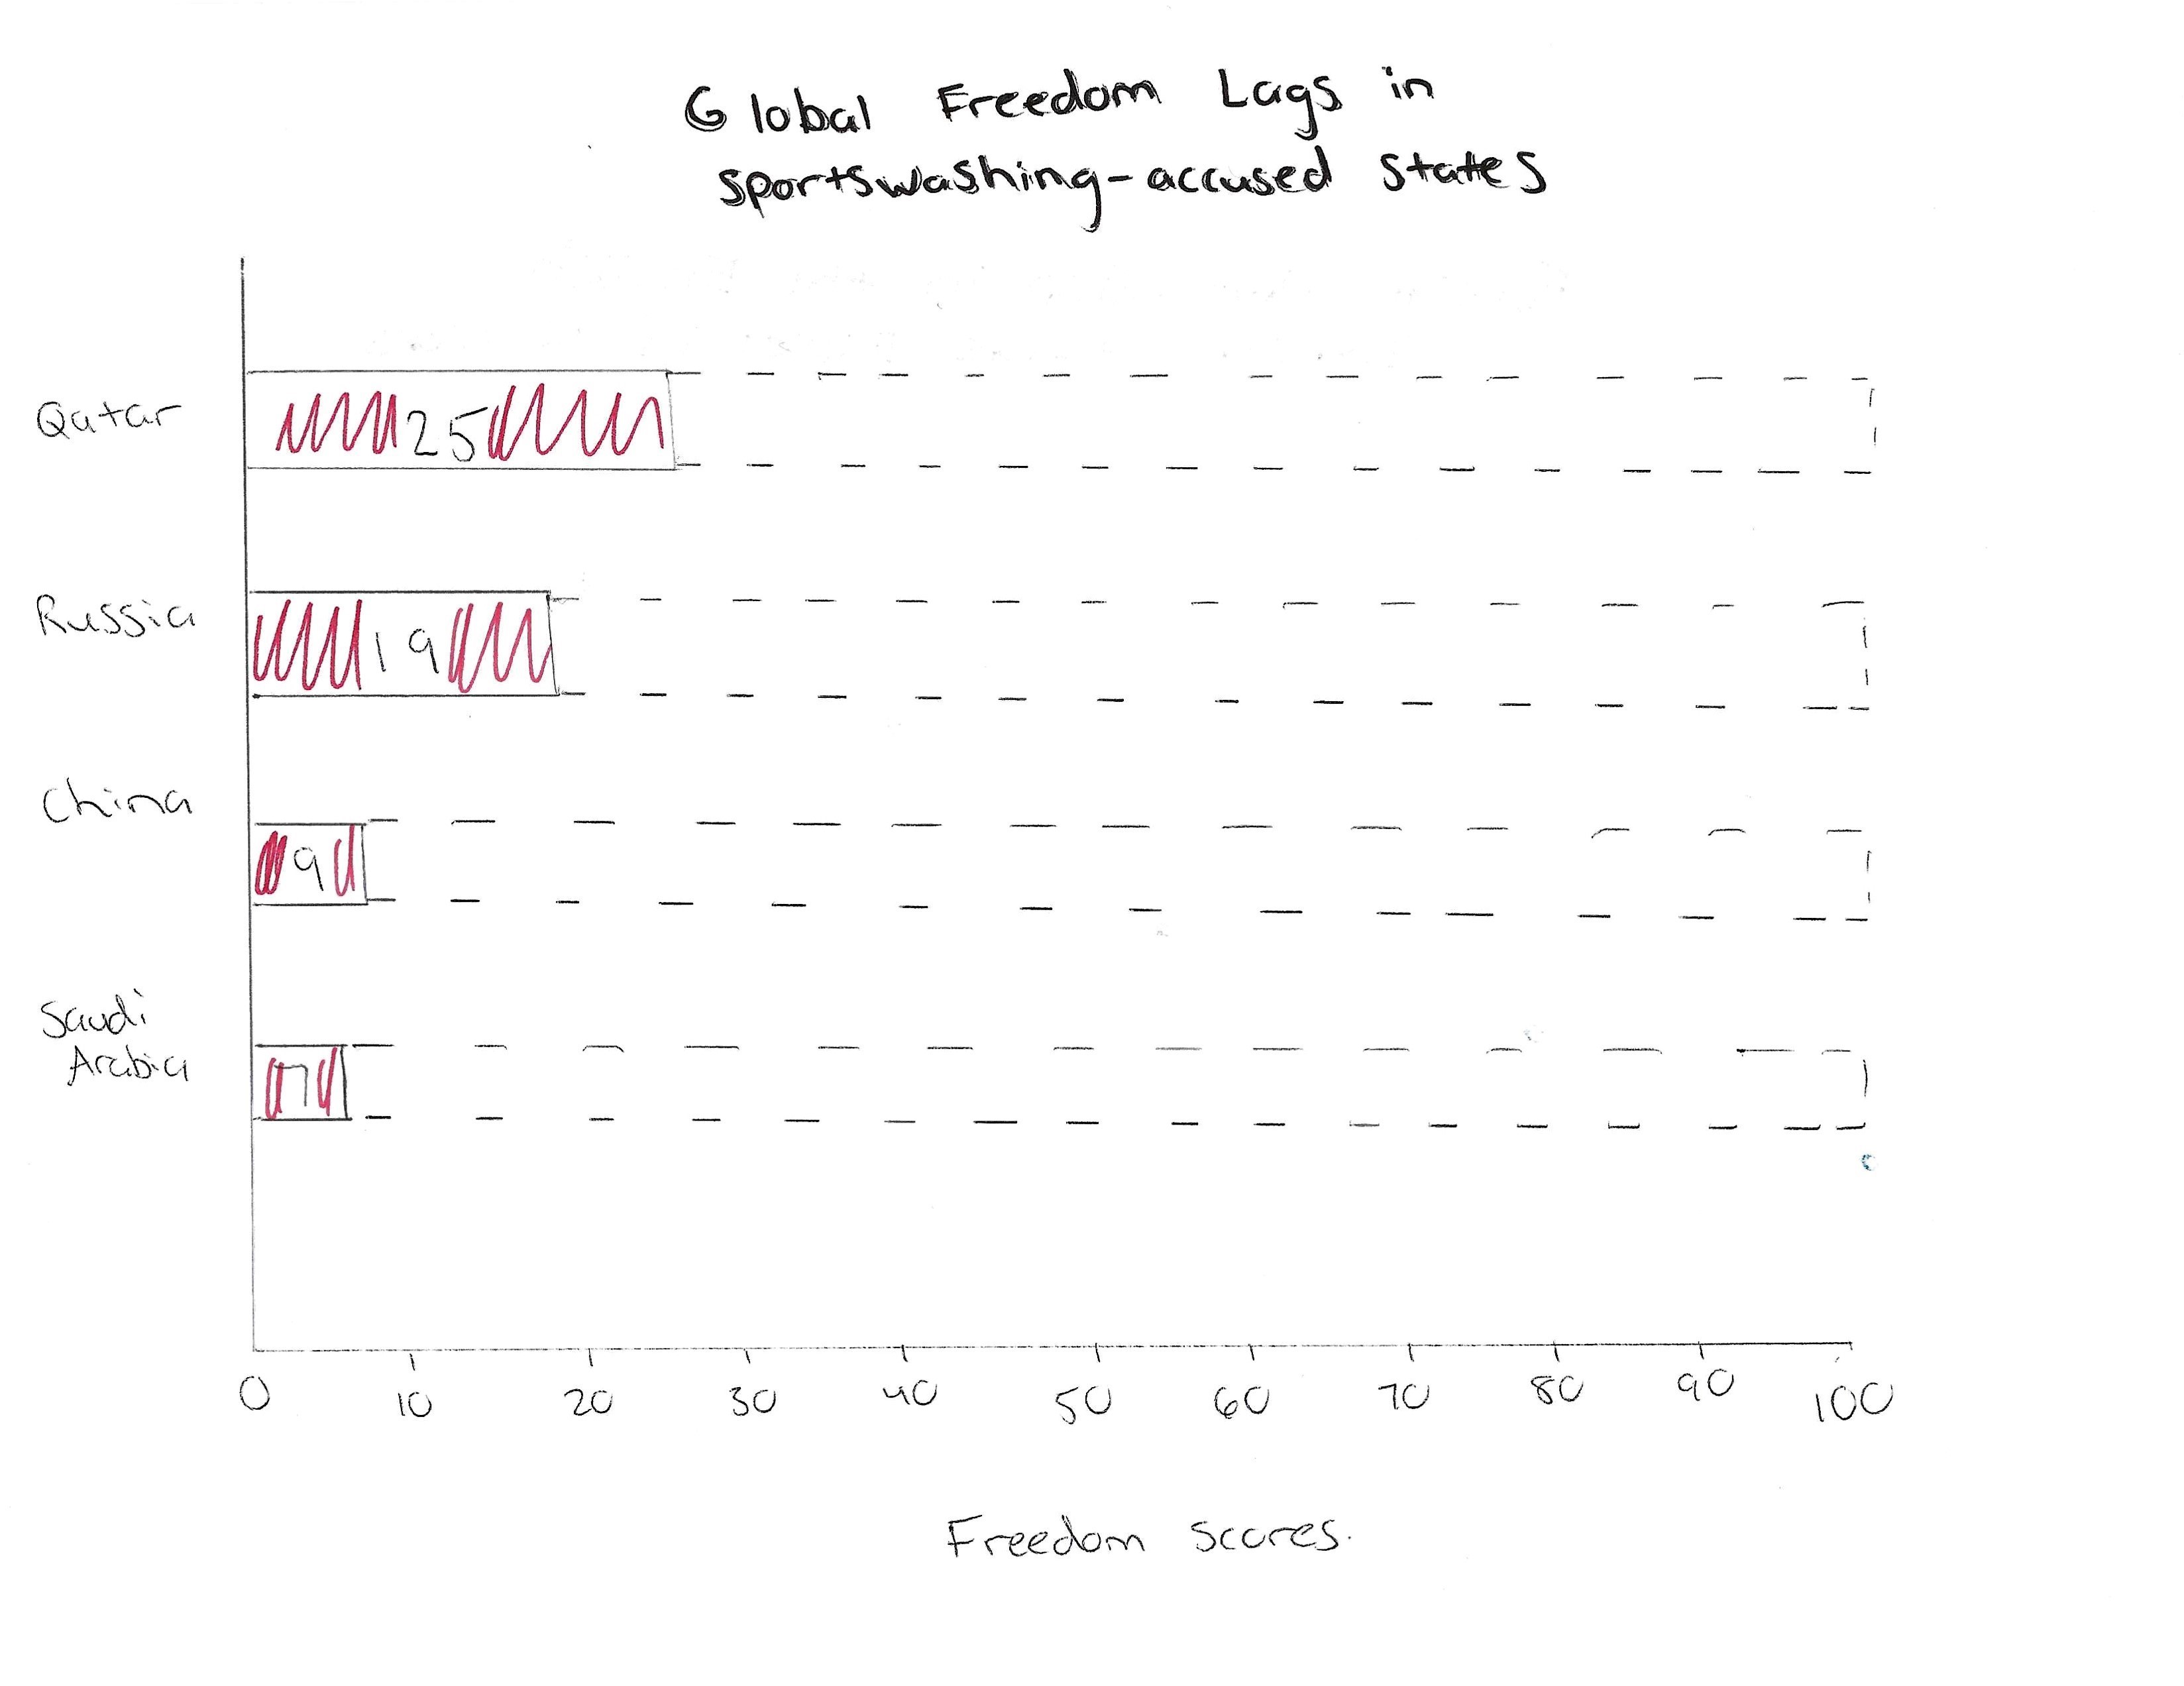 Freedom Houses’global freedom index is a useful tool to categorize states’ civil liberties and rights. These scores plot well in a horizontal bar chart or other comparison chart. The “ghost lines” were my attempt to show the gap in the sportswashing violators’ scores from better scores. However, an additional line showing the average freedom score for all states and/or including higher ranking countries may make the dataviz resonate more.
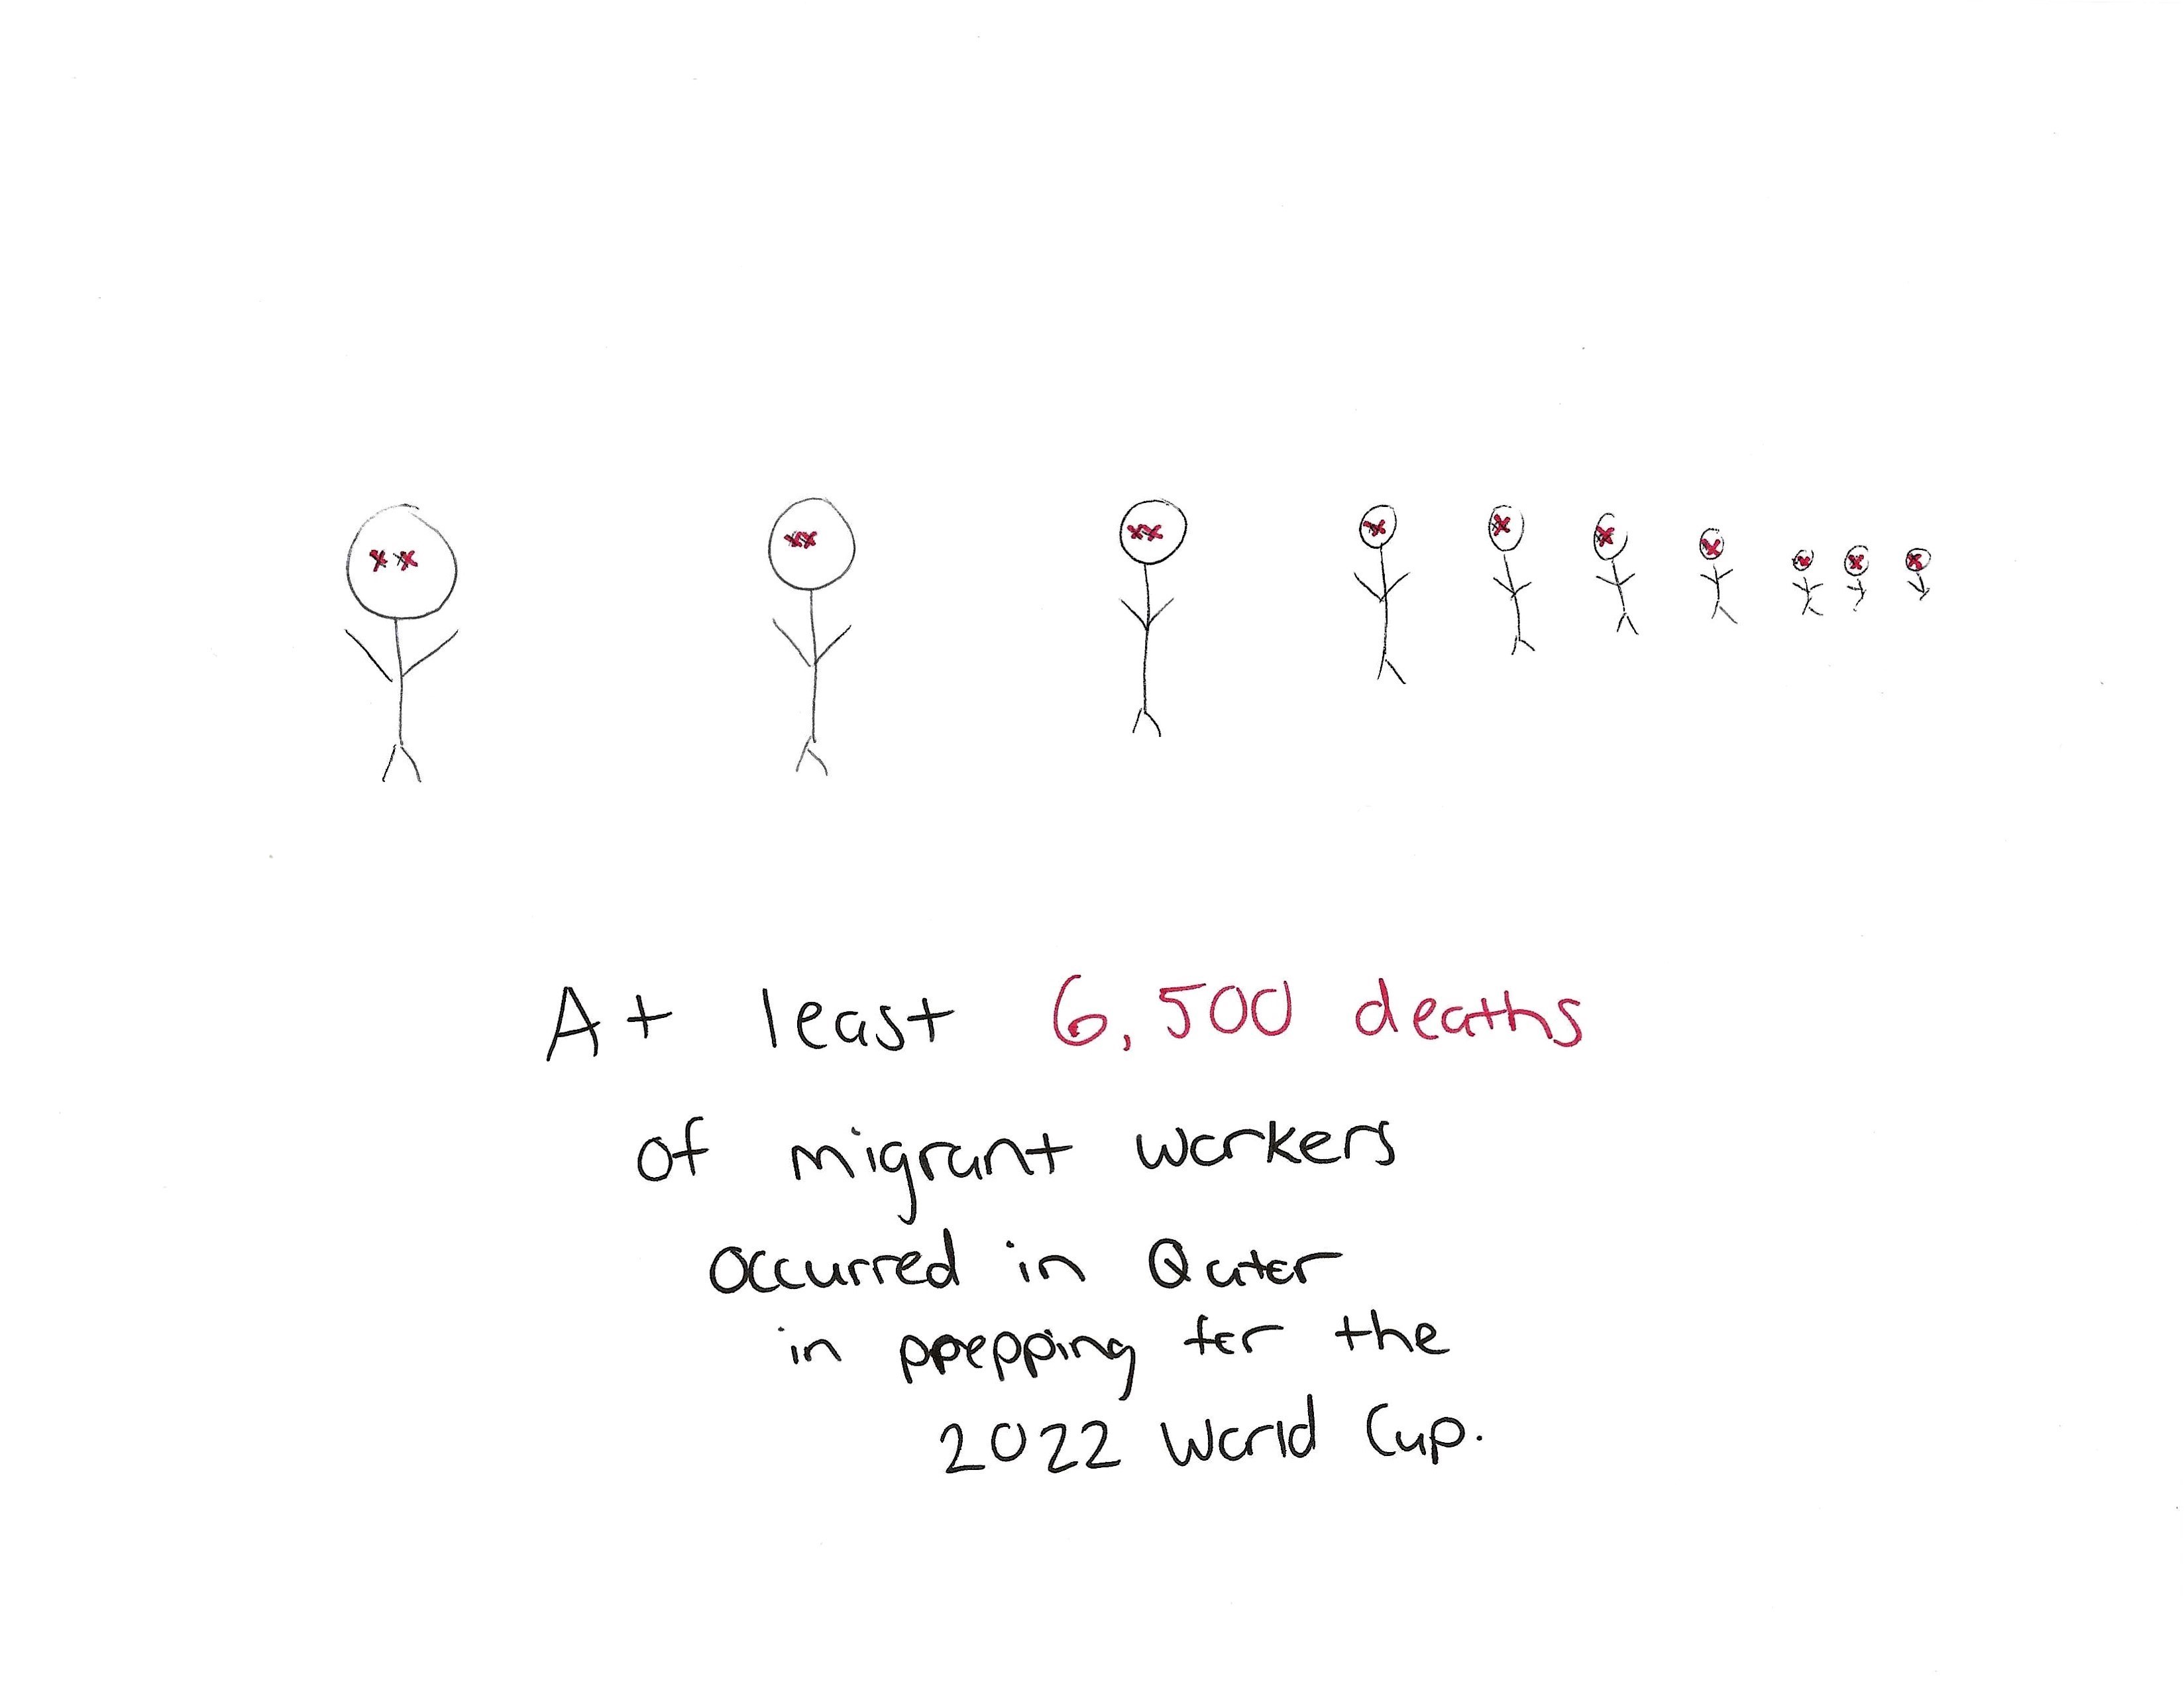 Albeit a bit crass, the minimalist visualization is illustrative of the horrors migrant workers endured in the years leading up to the 2022 World Cup in Qatar. A more polished wireframe may utilize a unit chart type rather than the pictorial approach as it can capture the magnitude of lives lost in a simpler and less triggering rendition of the data.
The data
For the core conflict of sportswashing, both CIRIGHTS and Freedom House’s publically-available data will provide invaluable rankings of nations’ human rights records and democratic freedoms. Utilizing US State Department Country Reports on Human Rights Practices from 1999-2021, CIRIGHTS provides a wealth of variables from state-sanctioned imprisonments to freedom of speech that can be visualized in trends and time lapses or even geographic maps in Tableau. Although admittedly more limited in scope, the aforementioned global freedom score from Freedom House can be used as a nice comparative tool demonstrating the lack of freedoms in the homes of sportswashing transgressors.
Not all of Statista’s content is publically acessible, yet CMU’s student access makes the company’s dossier on sportswashing available for our purposes. Public opinion polls like the thoughts of Brits on the Saudi-led Newcastle United FC takeover in the EPL and the money spent by Saudi Arabia on hosting sports events 2014-2031 data can be visualized in the conflict and setup portions of the sportwashing story, respectively.
As the story and direction becomes more solidified, I will most likely need to scrape data from publically-accessible sources. For instance, the previous sketch of foreign-born investment in EPL clubs can be found via club’s official websites. Transfermarkt provides easily accesible data on spending for soccer clubs around the world, which may be a solid inclusion in the overview section of money-in-sports.
| Name | URL | Description |
|---|---|---|
| CIRIGHTS | https://cirights.com/ | Human Rights Report Card |
| Freedom House | https://freedomhouse.org/countries/freedom-world/scores | Global Freedom Score |
| Statista | https://www-statista-com.cmu.idm.oclc.org/study/132367/sportswashing/ | Various Sportswashing Data |
Method and medium
To complete my final project, I intend on utilizing Infogram and Flourish for wireframing and then creating mutiple dataviz either through Flourish or Tableau (if I am feeling courageous). Shorthand will be my go to medium for the project due to its user-friendly interface and cohesive display designs. These dataviz and presentation methods and mediums will enable me to tell a compelling story about one of sports most glaring concerns in sportswashing.